3.11x to 4.63x ROAS.
Same cost per customer. 51% bigger orders.
Personalized gifts in Lebanon's Bekaa valley. Seven overlapping campaigns were cannibalizing budget, while a hidden mobile bug capped checkout values.
Where it started
Sales were wildly inconsistent. Our initial audit uncovered seven overlapping campaigns running identical mug creative, splitting a modest budget so thin that Meta's algorithm could never exit the learning phase.
Multiple unoptimized ghost campaigns were sitting at zero spend, driving up fatigue before the previous manager was removed from the account.
The problem wasn't the ads
Everyone blamed creative and targeting. But on mobile, where over 90% of paid traffic landed, the store theme only revealed the add-to-cart button on hover.
Hover does not exist on mobile devices. The button was trapped in the code, leaving customers with no functional way to add items to their basket.
What actually changed
Consolidated Fragmented Campaigns
Merged 7 competing campaigns into 1 streamlined ad set, giving Meta the volume required to exit the learning phase.
Fixed the Mobile Add-to-Cart Bug
Delivered the hover fix directly to Jenny's developer. Deployed live in 4 days.
Cut Spend on Unprofitable Segments
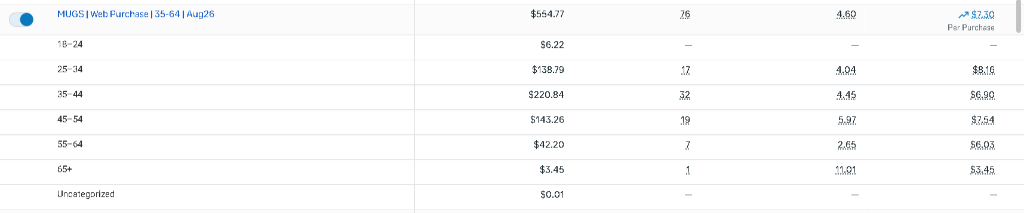
Reallocated budget away from <35 shoppers (0.83x ROAS) directly into buyers 35+ (5.83x ROAS).
The numbers
$543.84 spend generated $2,517 revenue (from $1,132.45 spend / $3,527 revenue baseline).
Revenue grew through larger baskets, not cheaper clicks.
Acquisition costs held steady while basket value surged.
The bottom-line revenue impact
At the same acquisition cost, that generated +$826 extra revenue per $543.84 spend, pacing for +$6,700/year in incremental gross.
Why we're not overclaiming this
Budget increased only after results improved. Because the consolidation, age targeting, and mobile fix launched together, this gain reflects the full rebuild, not a single factor.
At ~$550/month ad spend, these gains are verified, platform-measured, and repeatable, proving sound unit economics before scaling.
Straight from Meta Ads Manager
Pre-Rebuild Baseline

Post-Rebuild (Consolidated Campaign)

Targeting Breakdown by Age
How this was measured
Platform-reported in Meta Ads Manager (act_25210699) under a consistent 7-day click / 1-day view window. No tracking modifications were made mid-test.
Note: Platform purchases reflect initial checkouts. Final reconciliation against delivered Cash on Delivery (COD) orders is currently in progress.
Is your ad account fighting itself?
Most accounts suffer from competing campaigns and silent checkout leaks. We'll audit your setup for free.
Dominate your local market.